It's all about the answers!

Ask a question

JRS Build total report


Sterling Ferguson-II (1.6k10287273) | asked Nov 30 '17, 3:29 p.m.

CLM 602 and 604.


Hello all,

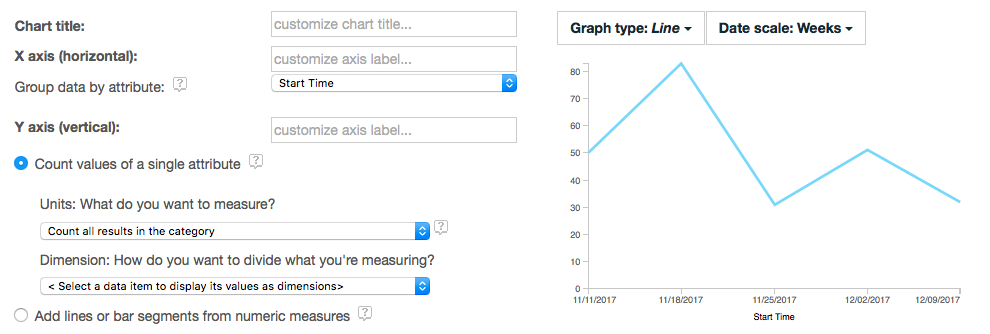
This could be me simply missing a selection or something. A customer wants to view all of the builds in the last month by week. They know that there have been 225 builds total for Nov. They want to produce a graph. They chose the Historical report and the Build artifact. They limited the scope by project. The results are 6000+ for every week. 

We have found that there have been 6000+ builds since they started RTC years ago, so something seems to be wrong with our selections, but nothing seems to help no matter what we select. If you take the builds end result (today) minus Nov1st you get 225. How can we get rid of this overall total?

thanks

Accepted answer


permanent link
Jackie Albert (1.6k14947) | answered Dec 07 '17, 2:56 p.m.
edited Dec 07 '17, 2:58 p.m.

 Have you tried building it out of the Current Data instead of using trend data?   I was able to build one relatively quickly using a condition limiting the 'Start Time' value from Build for items in the past month  (and scoping to a single project), and got this as a sample:  


Sterling Ferguson-II selected this answer as the correct answer

Comments
1
Sterling Ferguson-II commented Dec 14 '17, 8:47 p.m.

 thanks, 


it's getting harder to find the true purpose of the historical, as our planned reports don't seem to work.


Jackie Albert commented Dec 15 '17, 10:51 a.m.

Agreed - I get most of what I need out of the operational data.  

Your answer


Register or to post your answer.


Dashboards and work items are no longer publicly available, so some links may be invalid. We now provide similar information through other means. Learn more here.